Signed in as:
filler@godaddy.com

COMPANY ADDRESS
AVENIDA DOM PEDRO II 285, SALA 7 A, BARUERI , CEP 06401-060, SÃO PAULO SP BRASIL
CNPJ- 53.855.675/0001-89
EMAIL ADDRESS
cfo@agrideriaindustrialllc.com
TELEPHONE
+55 11 93323 4052 (BRAZIL)
+1 917-742-5881 (USA)
Agrideria already has its representation and office in Brazil, Agrideria Comércio Import
COMPANY ADDRESS
AVENIDA DOM PEDRO II 285, SALA 7 A, BARUERI , CEP 06401-060, SÃO PAULO SP BRASIL
CNPJ- 53.855.675/0001-89
EMAIL ADDRESS
cfo@agrideriaindustrialllc.com
TELEPHONE
+55 11 93323 4052 (BRAZIL)
+1 917-742-5881 (USA)
Agrideria already has its representation and office in Brazil, Agrideria Comércio Importacao Exportacao LTDA is the company that represents all businesses in Brazil

The new agrideria sugar warehouse will soon be available, only 5 km from the port of santos, where we will have stored 45 Icumsa sugar and 600-1200 Icumsa sugar.
It will come into service this month of September 2025.

Agrideria owns extensive plots of land for the farming of sugar cane and processing to convert it into a refined product within our own structure.
Although been working with producers and other associates of the industry for many years, being a company that dominates the entire process from planting to the final refined sugar, we are able
Agrideria owns extensive plots of land for the farming of sugar cane and processing to convert it into a refined product within our own structure.
Although been working with producers and other associates of the industry for many years, being a company that dominates the entire process from planting to the final refined sugar, we are able to confidently ensure the ability to have certified product on the market and deliver according to quality, schedules and time lines.
In this plat we also have the ability to do packaging for 50 kg, 25kg and 5 kg bags as well as private label packaging for special orders. We will work on special programs according to our clients needs.

Exports Advance and Trade Balance Surplus Soars in September
Brazil's trade balance registered a surplus of US$4.28 billion up to the third week of September 2026, a 130.8% increase compared to the same period in 2025. According to data released by the Ministry of Development, Industry, Trade and Services (MDIC), exports grew 21.5%, to US$
Exports Advance and Trade Balance Surplus Soars in September
Brazil's trade balance registered a surplus of US$4.28 billion up to the third week of September 2026, a 130.8% increase compared to the same period in 2025. According to data released by the Ministry of Development, Industry, Trade and Services (MDIC), exports grew 21.5%, to US$21.89 billion, while imports advanced 9%, to US$17.61 billion.
In the accumulated period from January to the third week of September, exports totaled US$272.75 billion, an 11.1% increase compared to the same period in 2025. Imports reached US$213.15 billion, a 5.8% increase.
With this result, the trade balance accumulated a surplus of US$ 59.60 billion, a growth of 35.2%. According to data released by the MDIC (Ministry of Development, Industry and Foreign Trade), the trade flow also advanced, with an increase of 8.7%, reaching US$ 485.89 billion.
Up to the third week of September, the three major sectors of the economy registered growth in exports. Agriculture advanced 12.5%, reaching US$ 4.44 billion.
The Extractive Industry showed growth of 44.7%, with exports of US$ 5.77 billion. The Manufacturing Industry increased its external sales by 15.3%, reaching US$ 11.44 billion.
In Agriculture, according to data released by the MDIC, the growth in exports was mainly driven by rye, oats and other unmilled cereals, whose sales advanced 60,899.1%. There was also growth in exports of unroasted coffee, of 12.5%, and soybeans, of 19.9%.
In the Extractive Industry, the highlights were other raw minerals, with a 79.6% increase, other ores and concentrates of base metals, with a growth of 117.6%, and crude petroleum oils or crude bituminous minerals, with an advance of 90.1%.
In the Manufacturing Industry, exports of soybean meal and other animal feed, meat and other animal meals grew by 76.1%. Sales of fuel oils from petroleum or bituminous minerals, except crude oils, advanced by 48.6%, while non-monetary gold, excluding gold ores and their concentrates, grew by 70.9%.
Despite the overall increase in exports, some products registered a decrease in external sales. In Agriculture, reductions occurred in unmilled corn, with a decline of 12.8%; Spices saw a 34.9% drop; and oilseeds such as sunflower, sesame, canola, cotton, and others experienced a 68.2% reduction.
In the extractive industry, exports of iron ore and its concentrates fell by 12%, while those of copper ores and their concentrates declined by 14.1%. Sales of nickel ores and their concentrates fell by 100%.
In the manufacturing industry, exports of fresh, chilled, or frozen beef decreased by 21.6%. Sugars and molasses declined by 17%, while sales of passenger cars fell by 27.8%.
Imports also increased in all three sectors. According to data released by the MDIC (Ministry of Development, Industry and Foreign Trade), agricultural imports grew by 18.1%, to US$ 0.33 billion.
In the extractive industry, imports increased by 34.8%, reaching US$ 0.90 billion. The Manufacturing Industry registered a 7.6% increase, with external purchases of US$ 16.28 billion.
Among agricultural products, imports of whole live, dead, or chilled fish grew by 43.5%. Purchases of fresh or dried fruits and non-oilseed nuts advanced by 28.9%, while soybean purchases increased by 55.3%.
In the Extractive Industry, growth was mainly influenced by purchases of other ores and concentrates of base metals, which rose by 75.8%; coal, even in powder form, but not agglomerated, with a 35.2% increase; and crude petroleum oils or crude bituminous minerals, which advanced by 60.4%.
In the Manufacturing Industry, imports of fuel oils from petroleum or bituminous minerals, except crude oils, grew by 69.8%. Purchases of automatic data processing machines and their units, for recording data, magnetic or optical readers, increased by 289.6%.
Imports of passenger motor vehicles also grew, with a rise of 100.2%.
On the other hand, some products saw a reduction in external purchases. In Agriculture, imports of unmilled wheat and rye fell by 12.7%, while those of unmilled corn, except sweet corn, decreased by 11.6%. Purchases of rye, oats, and other unmilled cereals decreased by 61.6%.
In the Extractive Industry, imports of crude fertilizers, except manures, fell by 50.4%. Purchases of aluminum ores and their concentrates decreased by 94.2%, while those of natural gas, liquefied or not, decreased by 18.3%.
In the manufacturing industry, imports of chemical fertilizers, excluding crude fertilizers, fell by 23.1%. Purchases of non-electric motors and machines and their parts, excluding piston engines and generators, dropped by 79.4%. Imports of platforms, vessels, and other floating structures decreased by 98%.
With exports growing more strongly than imports, Brazilian foreign trade increased its positive balance through the third week of September. According to data released by the MDIC (Ministry of Development, Industry and Foreign Trade), the result also boosted the trade flow and reinforced the accumulated growth for the year.

Brazilian exports advance 12.2%, with highlights including soybeans, coffee, live animals, chicken meat, and soybean meal; accumulated balance in 2026 reaches US$55.32 billion
The Brazilian trade balance ended August 2026 with a surplus of US$7.394 billion, a result 23.8% higher than that recorded in the same month of 2025. This performanc
Brazilian exports advance 12.2%, with highlights including soybeans, coffee, live animals, chicken meat, and soybean meal; accumulated balance in 2026 reaches US$55.32 billion
The Brazilian trade balance ended August 2026 with a surplus of US$7.394 billion, a result 23.8% higher than that recorded in the same month of 2025. This performance was sustained by the growth in exports, especially of products linked to agribusiness, the extractive industry, and manufacturing.
According to data from the Ministry of Development, Industry, Trade and Services (MDIC), Brazilian sales abroad totaled US$33.16 billion in August, a 12.2% increase year-on-year. Imports grew 9.2% and reached US$25.76 billion.
As a result, the trade flow — the sum of exports and imports — increased by 10.9% and reached US$ 58.92 billion in the month.
Trade balance accumulates surplus of US$ 55.32 billion
Between January and August 2026, Brazilian exports totaled US$ 250.86 billion, a growth of 10.3% compared to the same period of the previous year.
Imports totaled US$ 195.54 billion, with an increase of 6.1%. This performance guaranteed Brazil an accumulated trade surplus of US$ 55.32 billion, an expansion of 28.2% in the annual comparison.
The trade flow reached US$ 446.39 billion in the first eight months of the year, an increase of 8.4%.
Brazilian Agribusiness Exports Advance in August
Agribusiness exports totaled US$7.39 billion in August, an 11.4% increase compared to the same month in 2025. This positive performance was driven by sales of live animals, unroasted coffee, and soybeans.
Exports of live animals increased by 174.3%, while shipments of unroasted coffee grew by 24.1%. Soybeans, the main product in Brazil's agricultural export portfolio, registered a 14% increase.
In the manufacturing industry, products directly related to agribusiness also showed strong performance. External sales of poultry meat and offal grew by 40.5%, while exports of soybean meal and other animal feed increased by 36.6%.
Corn, Beef, and Sugar Decline in the Month
Despite the overall growth in exports, some important agribusiness products showed a decline in August.
Shipments of unmilled corn fell 25.3%, while external sales of natural honey declined 34.7%. Exports of other oilseeds, such as sunflower, sesame, canola, and cotton, decreased by 35.7%.
In the manufacturing industry, exports of fresh, chilled, or frozen beef fell by 19.7%. Sugars and molasses registered an even more intense contraction of 37%.
Soybeans and cotton sustain growth in the accumulated total for 2026
Between January and August, agricultural exports totaled US$ 57.85 billion, a 9.5% increase compared to the same period in 2025.
The advance was favored by an 81.9% increase in sales of live animals, a 15.2% increase in soybean shipments, and a 15.1% increase in raw cotton exports.
The extractive industry exported US$62.14 billion in the period, a growth of 19.6%. The manufacturing industry, meanwhile, moved US$129.41 billion in international sales, an increase of 6.6%.
Among processed products, beef showed accumulated growth of 22.3%, despite the contraction observed only in August. Fuel oils also stood out, with a 33.2% increase, and non-monetary gold, with an expansion of 58.7%.
Coffee, corn, wheat, and sugar accumulated declines in exports.
The positive performance of the trade balance was not uniform among agribusiness products. From January to August, exports of wheat and rye decreased by 31.3%, while corn shipments fell by 3.6%.
International sales of unroasted coffee fell by 13.7% cumulatively, even with the growth recorded in August alone.
In the manufacturing industry, exports of fruit and vegetable juices fell by 35.8%, while sugars and molasses accumulated a drop of 28.2%.
Imports grow with the advance of the manufacturing industry
Brazilian imports totaled US$ 25.76 billion in August. The growth was led by the manufacturing industry, which purchased US$ 24.12 billion in foreign products, an increase of 13.4%.
In agriculture, imports grew by 7.4% and reached US$ 470 million. The movement was influenced by the increase in purchases of fish, wheat, rye, and horticultural products.
Imports of fish advanced 64.8%, while acquisitions of wheat and rye grew by 10.5%. External purchases of fresh or refrigerated horticultural products increased by 54%.
Conversely, soybean imports fell by 22.2%, and imports of fruits and non-oilseed nuts decreased by 9.3%.
Imports of chemical fertilizers decreased by 35.9% in August
Among the strategic inputs for agricultural production, imports of fertilizers and chemical fertilizers, excluding raw fertilizers, fell by 35.9% in August.
Purchases of raw fertilizers also decreased, with a 15.6% drop compared to the same month of the previous year.
This movement deserves attention because Brazil remains dependent on the external market to supply a large part of the agricultural demand for nutrients. Changes in the imported volume may reflect factors such as anticipation of purchases, stock formation, international prices, exchange rates, and the pace of crop planting.
Imports total US$ 195.54 billion in the year
In the accumulated total for the first eight months of 2026, agricultural imports totaled US$ 3.66 billion, a decrease of 12.3%. The extractive industry imported US$ 8.25 billion, a decrease of 5.5%.
The manufacturing industry, in turn, increased its foreign purchases by 7.1%, reaching US$182.35 billion and accounting for the largest share of Brazilian imports.
Among agricultural products, accumulated imports of fish, horticultural products, and soybeans increased. Conversely, purchases of wheat and rye, cocoa, and natural rubber decreased.
Agribusiness remains strategic for Brazil's trade balance
The August results reinforce the relevance of agribusiness for generating foreign exchange and maintaining the surplus in Brazil's trade balance.
The appreciation of exports of soybeans, coffee, live animals, chicken meat, and soybean meal helped to offset the declines observed in corn, beef, sugar, and honey.
The scenario also shows the diversity of Brazil's export portfolio and the importance of monitoring the behavior of international prices, exchange rates, demand from major buyers, and domestic supply. These factors will continue to determine the performance of foreign trade and the competitiveness of Brazilian agribusiness products in the coming months.

Exports from the sector hit a record for July, reaching US$16.34 billion, and accumulated US$103.39 billion for the year, reinforcing the contribution of agribusiness to the Brazilian trade surplus.
Brazilian agribusiness maintained its strength in foreign trade in July 2026 and was again decisive for the positive result of the country's t
Exports from the sector hit a record for July, reaching US$16.34 billion, and accumulated US$103.39 billion for the year, reinforcing the contribution of agribusiness to the Brazilian trade surplus.
Brazilian agribusiness maintained its strength in foreign trade in July 2026 and was again decisive for the positive result of the country's trade balance. According to the Monthly Monitoring Report of Foreign Trade, prepared by the Economic Department of the Federation of Agriculture and Livestock of the State of São Paulo (Faesp), based on data from MDIC/ComexStat, agricultural exports reached US$16.34 billion in the month, a record for July and a 5.4% increase compared to the same month of 2025. Imports from the sector totaled US$1.75 billion, resulting in a surplus of US$14.59 billion, an annual increase of 6.5%.
The performance gains even more relevance when considering the year-to-date figures. Between January and July, Brazilian agribusiness exports totaled US$103.39 billion, a 6% increase over the US$97.50 billion recorded in the same period of 2025. Imports, in turn, decreased by 1.4%, to US$11.71 billion, guaranteeing the sector a positive trade balance of US$91.68 billion in the first seven months of 2026. In the same period, the Brazilian trade balance as a whole showed a surplus of US$49.04 billion, highlighting the contribution of agribusiness to the generation of foreign exchange and the balance of the country's external accounts.
Among the products that boosted exports in July, soybeans maintained their leadership, with US$5.87 billion exported, a 17.4% increase year-on-year. Also showing strong performance were cellulose, with a 30.8% increase; soybean meal, 28.6%; fresh chicken meat, 33.9%; and cotton, 27.2%. Crude soybean oil presented one of the largest expansions, with an advance of 184.3%, reaching US$ 370.2 million.
In São Paulo, despite the contraction observed in some important chains, agribusiness continued to contribute to the state's foreign trade results. The sector registered a surplus of US$ 1.7 billion in July, while the other segments of the São Paulo economy, combined, had a deficit of US$ 4.3 billion.
Exports from São Paulo's agribusiness totaled US$ 2.23 billion in July, equivalent to 13.7% of Brazilian exports in the sector for the month. Among the highlights, soybeans advanced 14.8%, reaching US$ 201.7 million. Exports of crude soybean oil (+70.2%), uncarded and uncombed cotton (+124.1%), soluble coffee (+60%), and orange essential oil (+85.2%) also registered strong growth.
These figures reinforce the agribusiness sector's ability to generate revenue, conquer markets, and contribute to Brazilian economic stability, even in an international scenario marked by price fluctuations, changes in trade flows, and new tariff barriers. In this environment, diversification of destinations, production competitiveness, and increased market access become increasingly strategic for preserving and expanding the leading role of Brazilian agribusiness in world trade.

The Ministry of Development, Industry, Trade and Services (MDIC) released on Monday (20) the Trade Balance data for the third week of July 2026. The numbers show an advance in Brazilian exports and an increase in the trade surplus compared to the same period last year.
According to the MDIC, up to the third week of July, exports grew 6.7%
The Ministry of Development, Industry, Trade and Services (MDIC) released on Monday (20) the Trade Balance data for the third week of July 2026. The numbers show an advance in Brazilian exports and an increase in the trade surplus compared to the same period last year.
According to the MDIC, up to the third week of July, exports grew 6.7% compared to July 2025, totaling US$ 19.38 billion. Imports advanced 1.6%, reaching US$ 14.43 billion. With this performance, the trade balance registered a surplus of US$ 4.95 billion, an increase of 25.2%, while the trade flow increased 4.5%, reaching US$ 33.82 billion.
In the period from January to the third week of July, the MDIC (Ministry of Development, Industry and Foreign Trade) reported that exports totaled US$ 204.16 billion, a growth of 10.8% compared to the same period in 2025. Imports totaled US$ 156.85 billion, an increase of 4.9%. As a result, the trade surplus reached US$ 47.31 billion, an expansion of 36.7%, and the trade flow reached US$ 361 billion, with an increase of 8.2%.
In the sectoral analysis of July exports, the MDIC pointed to growth of 6.5% in agriculture, which totaled US$ 4.31 billion, 17.2% in the extractive industry, with US$ 4.92 billion, and 1.4% in the manufacturing industry, which reached US$ 9.99 billion.
The ministry highlighted that the increase in foreign sales was mainly driven by higher exports of raw tobacco, soybeans, and raw cotton in the agricultural sector. In the extractive industry, sales of other raw minerals, nickel ores, and crude oil grew. In the manufacturing industry, the highlights were poultry meat, soybean meal, and petroleum fuel oils.
Despite the positive result, some products registered a decline in exports. The MDIC (Ministry of Development, Industry and Foreign Trade) pointed to decreases in sales of unmilled corn, fresh or dried fruits and nuts, and unroasted coffee in the agricultural sector. In the extractive industry, shipments of stone, sand and gravel, iron ore, and copper ore decreased. In the manufacturing industry, the declines affected sugar, passenger cars and aircraft, and related equipment.
On the import side, the ministry reported a 16.3% drop in agricultural imports, totaling US$240 million, while the extractive industry grew by 37.7%, to US$780 million, and the manufacturing industry advanced by 0.4%, reaching US$13.33 billion.
The growth in imports was influenced by increased purchases of whole live, dead, or chilled fish, barley, and horticultural products in the agricultural sector. In the extractive industry, imports of other ores and concentrates of base metals, crude oil, and natural gas increased. In the manufacturing industry, purchases of fuel oils, automatic data processing machines, and electronic components such as valves, diodes, and transistors grew.
On the other hand, the MDIC (Ministry of Development, Industry and Foreign Trade) recorded a reduction in imports of wheat and rye, soybeans, and natural rubber in the agricultural sector. In the extractive industry, purchases of iron pyrite, coal, lignite, and peat fell. In the manufacturing industry, there was a decrease in imports of medicines, pesticides, and non-electric motors and machinery.

The Ministry of Development, Industry, Trade and Services (MDIC) released on Monday (6) the results of the trade balance for the first week of July 2026. Compared to the same period in July 2025, exports grew 40.6% and totaled US$ 5.89 billion, while imports increased 10.4%, totaling US$ 3.62 billion. As a result, the trade balance surplu
The Ministry of Development, Industry, Trade and Services (MDIC) released on Monday (6) the results of the trade balance for the first week of July 2026. Compared to the same period in July 2025, exports grew 40.6% and totaled US$ 5.89 billion, while imports increased 10.4%, totaling US$ 3.62 billion. As a result, the trade balance surplus reached US$ 2.27 billion, an increase of 149%, and the trade flow advanced 27.3%, reaching US$ 9.51 billion.
In the period from January to the first week of July 2026, Brazilian exports reached US$190.66 billion, an increase of 11.8% compared to the same period in 2025. Imports totaled US$146.03 billion, a rise of 5.4%. This result increased the trade surplus to US$44.63 billion, a 39.2% increase, while the trade flow reached US$336.70 billion, an 8.9% increase.
In the exports of the first week of July, agriculture registered growth of 1.5%, with shipments of US$950 million. The extractive industry showed an increase of 81.7%, reaching US$1.76 billion, and the manufacturing industry advanced 39.4%, totaling US$3.17 billion. The combined performance of the three sectors sustained the expansion of foreign sales.
Among the products that contributed most to this result are unroasted coffee, with an increase of 13.6%, soybeans, which grew by 1.3%, and raw cotton, which increased by 90.5% in the agricultural sector. In the extractive industry, sales of iron ore and its concentrates stood out, with growth of 8.7%, copper ores and their concentrates, which advanced 50.4%, and crude petroleum oils or bituminous minerals, with an increase of 134.5%. In the manufacturing industry, growth was driven by exports of fresh, chilled or frozen beef, which rose 43.9%, petroleum fuel oils, with an increase of 243.6%, and non-monetary gold, which advanced 148.3%.
Despite the positive result, some products registered a decrease in exports. In agriculture, there was a decline in sales of paddy rice, unmilled corn (except sweet corn), and spices. In the extractive industry, exports of crude fertilizers and nickel ores and their concentrates decreased. In the manufacturing industry, shipments of sugars and molasses, semi-finished iron or steel products, and iron or steel hollow tubes and profiles decreased.
Imports also showed growth in the first week of July. Agriculture advanced 15%, with purchases of US$70 million, while the extractive industry grew 86.6%, reaching US$250 million. The manufacturing industry registered a 7.4% increase, totaling US$3.29 billion, a performance that sustained the increase in Brazilian imports.
The growth in foreign purchases was driven by higher imports of wheat and rye, barley, and unmilled corn in agriculture. In the extractive industry, acquisitions of stone, sand and gravel, other ores and concentrates of base metals, and crude petroleum oils stood out. In the manufacturing industry, purchases of fertilizers and chemical fertilizers, automatic data processing machines, and valves, thermionic tubes, diodes, and transistors increased.
On the other hand, some products registered a reduction in imports. Among them are whole live, dead, or chilled fish, soybeans, and latex in agriculture. In the extractive industry, purchases of raw fertilizers, unroasted iron pyrites, and coal fell. In the manufacturing industry, imports of medicines, insecticides, and non-electric motors and machines decreased.

Brazil’s trade balance reached a $4.2 billion surplus in February, the Ministry of Development, Industry, Trade and Services said on Thursday (March 5), swinging from a year-earlier deficit
Exports from Latin America’s largest economy rose 15.6% from a year earlier to $26.3 billion, while imports dropped 4.8% to $22.1 billion.
Brazil p
Brazil’s trade balance reached a $4.2 billion surplus in February, the Ministry of Development, Industry, Trade and Services said on Thursday (March 5), swinging from a year-earlier deficit
Exports from Latin America’s largest economy rose 15.6% from a year earlier to $26.3 billion, while imports dropped 4.8% to $22.1 billion.
Brazil posted a $500 million deficit in February 2025.
The country’s economy is showing clearer signs of slowing after the central bank held interest rates at a nearly 20-year high of 15% since July last year.
Brazilian shipments of items such as crude oil, iron ore and soybeans rose, while those of products including cotton and sugar declined.
On the import side, which is more diversified, the main drag in the month came from a fall in purchases of non-electric engines and machines.
In January, the ministry estimated that Brazil’s trade surplus this year will range between $70 billion and $90 billion, above the $68.3 billion surplus recorded in 2025.

Exports Grow and Positive Balance Reinforces Brazilian Foreign Trade at the Beginning of the Year
Brazil's trade balance registered a surplus of US$5.136 billion between January and the second week of February 2026, with a total trade flow of US$72.625 billion. The preliminary data was released this Thursday (February 19th) by the Foreign
Exports Grow and Positive Balance Reinforces Brazilian Foreign Trade at the Beginning of the Year
Brazil's trade balance registered a surplus of US$5.136 billion between January and the second week of February 2026, with a total trade flow of US$72.625 billion. The preliminary data was released this Thursday (February 19th) by the Foreign Trade Secretariat of the Ministry of Development, Industry, Trade and Services (MDIC).
Surplus and Trade Flow at the Beginning of 2026
During this period, the country exported US$38.88 billion and imported US$33.744 billion, guaranteeing a positive balance for foreign trade.
In the second week of February, the weekly results showed:
Surplus: US$ 1.501 billion
Exports: US$ 6.952 billion
Imports: US$ 5.451 billion
Weekly trade flow: US$ 12.403 billion
Accumulated figures for the month up to the second week:
Exports: US$ 13.727 billion
Imports: US$ 12.934 billion
Positive balance: US$ 793 million
Trade flow: US$ 26.661 billion
Growth in daily averages of exports and imports
Compared to February 2025, there was significant growth in daily averages:
Exports: daily average of US$ 1.30 billion (+20.7% compared to 2025)
Imports: daily average of US$ 1.29 billion (+11.4% compared to 2025)
O Performance reinforces the recovery of Brazilian foreign trade and the strengthening of the country's presence in international markets.
Performance by economic sectors
Exports
Extractive Industry: +57.2%
Manufacturing Industry: +15.9%
Agriculture: +1.4%
Imports
Extractive Industry: +20.0%
Manufacturing Industry: +11.8%
Agriculture: -13.4%
The growth in exports of manufactured goods and the extractive industry contributes to the increase in the surplus, while the decline in imports from the agricultural sector indicates an adjustment in input flows.
Economic context and Central Bank projections
According to the Central Bank of Brazil, the 2025 trade surplus was US$ 60 billion, a decrease of 8.9% compared to the previous year, due to increased imports. Projections for 2026 indicate a continued positive balance, with exports between US$340 billion and US$380 billion and imports between US$270 billion and US$290 billion.
This performance reinforces the importance of foreign trade for the Brazilian economy, especially for the agro-industrial sector, which maintains a significant share of exports.

Brazilian agribusiness performance shows slight annual decline, but maintains strong share in the trade balance
Brazilian agribusiness exports totaled US$15.4 billion in March 2026, according to data released by the Secretariat of Foreign Trade (Secex). The result represents a slight decrease of 0.7% compared to the same month last year, r
Brazilian agribusiness performance shows slight annual decline, but maintains strong share in the trade balance
Brazilian agribusiness exports totaled US$15.4 billion in March 2026, according to data released by the Secretariat of Foreign Trade (Secex). The result represents a slight decrease of 0.7% compared to the same month last year, reflecting the combination of lower shipped volume in some segments and price fluctuations in the international market.
Despite the overall decline, products such as soybeans, beef, cotton, and wheat showed positive performance, while ethanol, refined sugar, green coffee, and cellulose registered a decrease in shipments.
Soybeans sustain revenues with high international prices
The soybean complex continued to be the main highlight of Brazilian agribusiness exports in March. Shipments of soybeans reached 14.5 million tons, generating revenue of US$5.9 billion. Although the volume was 1% lower than that recorded in March 2025, international prices compensated for part of the drop. The average export value rose 5.3% year-on-year, reaching US$408 per ton.
In soybean meal, the exported volume totaled 1.9 million tons, a 4% increase over March of last year. The average price was US$347 per ton, slightly above that observed in 2025.
Soybean oil, however, registered a decrease in shipments. 180,000 tons were exported, a 7.8% drop year-on-year. In contrast, the average price rose for the third consecutive month, reaching US$1,165 per ton, a 13% increase.
Sugar exports grow, but prices fall
In the sugar-energy complex, VHP sugar showed an increase in the volume shipped. Exports reached 1.6 million tons, a 2% increase compared to March 2025.
Despite the increase, prices fell significantly. The average price of VHP sugar dropped 24%, to US$354 per ton.
Refined sugar performed even weaker. Shipments totaled 254,000 tons, a 19% decrease compared to the same period last year. The average price also fell, to US$421 per ton, a decrease of 18%.
Ethanol exports plummet 68% in March
Ethanol was one of the worst-performing products among Brazilian agribusiness exports. In March, shipments totaled only 74,000 tons, a 68% drop compared to the same month in 2025.
Even with the sharp reduction in export volume, the average price increased by 7%, reaching US$595 per cubic meter.
Cotton Exports Increase by 45% and Expand Share of Exports
Cotton lint exports grew significantly in March. The volume shipped reached 348,000 tons, a 45% increase compared to the same period last year.
The increase in shipments occurred even with falling international prices. The average price of the product fell for the sixth consecutive month, reaching US$1,532 per ton, a 9.4% reduction compared to March 2025.
Beef Exports Register Increase in Volume and Price
Brazilian beef exports maintained a positive trajectory. In March, shipments reached 234,000 tons, an 8.7% increase over the same period last year.
China remained the main destination for Brazilian beef, accounting for 102,000 tons, equivalent to 44% of the total volume exported.
In addition to the increase in shipments, the average price of exported beef rose for the fifth consecutive month. The value reached US$5,815 per ton, a 19% increase year-on-year and a 3% increase compared to February.
Conflict in the Middle East puts pressure on freight and logistics costs
The geopolitical scenario in the Middle East has begun to directly affect the logistics costs of Brazilian meat exports.
According to the sector, maritime freight per refrigerated container destined for the region has more than doubled in recent months. The value jumped from approximately US$2,800 to as much as US$7,000 per container.
The increase is related to temporary restrictions on strategic routes, such as the Strait of Hormuz, as well as cargo redirections and interruptions in maritime transport.
The rise in costs increases the pressure on Brazilian exporters, especially in sales destined for Middle Eastern countries.
Brazilian Chicken Meat Exports Grow, But Middle East Loses Strength
Brazilian exports of fresh chicken meat totaled 431,000 tons in March, a 6% increase compared to the same month in 2025.
The average export price was US$1,888 per ton, practically stable year-on-year.
Even with the positive result, shipments destined for the Middle East fell 19% in March compared to February, reflecting the logistical difficulties caused by the conflict in the region.
Nevertheless, more than 100,000 tons of chicken meat were sent to the Middle East during the month.
Other markets, however, compensated for the regional slowdown. China resumed increasing purchases after the avian influenza outbreak recorded in 2025. Japan, the European Union, and South Africa also increased their imports of Brazilian chicken meat.
Pork, corn, and wheat appear among the largest growth rates
Among the products with the greatest expansion in exports in March, wheat led with an 81% increase in volume shipped compared to the previous year.
Rice grew by 79%, followed by cotton, with 45%, and frozen concentrated orange juice, which advanced 34%.
Fresh pork also registered strong performance, with a 28% increase in exports. Corn advanced 13%, while beef and chicken grew 9% and 6%, respectively.
Green coffee and cellulose exports decline
Among the segments with the worst performance in March, ethanol led the losses, with a 68% drop in shipments.
Also registering a decline were green coffee, with a 31% drop, and cellulose and refined sugar, both with a 19% decrease.
Soybean oil exports fell by 8%, while soybean grain exports saw a slight decrease of 1%.
Accumulated agricultural exports grow in the first quarter
In the accumulated period from January to March 2026, several products still show positive export performance.
Soybean grain exports registered a 6% growth in volume shipped, while soybean oil advanced 33%. Beef accumulated a 20% increase, chicken grew 5%, and pork advanced 15%.
In the sugar-energy complex, raw sugar showed a 10% increase in exports, while ethanol accumulated a 61% drop in the first quarter.
Among agricultural products, corn saw a 15% increase and orange juice advanced 13%. Green coffee, wheat, cellulose, and tobacco continue to underperform compared to the first three months of 2025.
Outlook for the coming months
The trend for the coming months is for continued strength in soybean and protein exports, driven by international demand and price recovery in some markets.
On the other hand, geopolitical instability, high logistics costs, and falling prices for products such as sugar, cotton, and coffee may limit the growth of Brazilian agribusiness revenues throughout 2026.

The Brazilian trade balance registered a lower-than-expected surplus in March, according to data released this Tuesday by the Ministry of Development, Industry, Trade and Services (MDIC), which now forecasts a positive balance of US$72.1 billion in 2026, close to the lower end of the projection made in January.
The ministry's new estimate
The Brazilian trade balance registered a lower-than-expected surplus in March, according to data released this Tuesday by the Ministry of Development, Industry, Trade and Services (MDIC), which now forecasts a positive balance of US$72.1 billion in 2026, close to the lower end of the projection made in January.
The ministry's new estimate points to exports of US$364.2 billion this year, compared to the January forecast of a range between US$340 billion and US$380 billion. For imports, the MDIC expects a value of US$292.1 billion, compared to a range of US$270 billion to US$290 billion previously.
The increase in the projected level for imports led to a forecast of a surplus for the year of US$72.1 billion, compared to the January estimate of US$70 billion to US$90 billion. In 2025, the country recorded a trade surplus of US$68.1 billion.
According to the Director of Statistics and Foreign Trade Studies at the MDIC (Ministry of Development, Industry and Foreign Trade), Herlon Brandão, import projections are affected by the level of economic activity – which has shown resilience – and international prices. He stated that the potential persistence of price shocks due to the war in Iran could lead to further revisions of trade balance projections.
"We know that the international scenario presents challenges... but based on the information we have so far, looking at economic activity, exchange rates, and consumption, the models point to this result," he said.
"And even with variations, looking at the direction and level (of the projection), we observe a relatively stable and resilient Brazilian foreign trade in the face of crises."
MARCH DATA
The result for the month of March, a surplus of US$6.405 billion, was below the expectations of economists in a Reuters poll, which pointed to a surplus of US$7.350 billion. The month's performance was the result of US$31.603 billion in exports, 10% higher than in March 2025, and US$25.199 billion in imports, a 20.1% increase in the same comparison.
In exports, there was an increase in shipments from all sectors, with the extractive industry standing out with a 36.4% increase driven by a significant rise in oil sales. Gains were 5.4% in the manufacturing industry, with higher sales of meat and fuels, and 1.1% in agriculture, with higher sales of soybeans.
On the import side, there was a 54.4% increase in the arrival of consumer goods, 26.5% for capital goods, 16.2% for fuels, and 10.4% for intermediate goods.
In the first quarter, the country accumulated a trade surplus of US$14.175 billion, above the positive balance of US$9.606 billion for the first three months of 2025.

Brazilian agribusiness earned US$12.05 billion in export revenue in February, the best result in the historical series for the month, with a 7.4% increase year-on-year driven by shipments of soybeans and meat, according to a note from the Ministry of Agriculture.
Soybean complex products (grain, meal, and oil) registered a 16.4% increase i
Brazilian agribusiness earned US$12.05 billion in export revenue in February, the best result in the historical series for the month, with a 7.4% increase year-on-year driven by shipments of soybeans and meat, according to a note from the Ministry of Agriculture.
Soybean complex products (grain, meal, and oil) registered a 16.4% increase in total exports, to US$3.78 billion; followed by meat, with US$2.7 billion, a 22.5% increase.
Forestry products generated revenues of US$1.27 billion, a 1% decrease; coffee, US$1.12 billion, practically stable; and the sugar and ethanol complex had external sales of US$861.35 million, a 4.2% decrease.
China remained the main destination for Brazilian agricultural exports, with US$3.6 billion and a 30.5% share of total exports. Next were the European Union, with US$1.8 billion (15.2%), and the United States, with US$802.9 million (7%).
Brazil’s trade balance reached a $4.2 billion surplus in February, the Ministry of Development, Industry, Trade and Services said on Thursday (March 5), swinging from a year-earlier deficit
Exports from Latin America’s largest economy rose 15.6% from a year earlier to $26.3 billion, while imports dropped 4.8% to $22.1 billion.
Brazil p
Brazil’s trade balance reached a $4.2 billion surplus in February, the Ministry of Development, Industry, Trade and Services said on Thursday (March 5), swinging from a year-earlier deficit
Exports from Latin America’s largest economy rose 15.6% from a year earlier to $26.3 billion, while imports dropped 4.8% to $22.1 billion.
Brazil posted a $500 million deficit in February 2025.
The country’s economy is showing clearer signs of slowing after the central bank held interest rates at a nearly 20-year high of 15% since July last year.
Brazilian shipments of items such as crude oil, iron ore and soybeans rose, while those of products including cotton and sugar declined.
On the import side, which is more diversified, the main drag in the month came from a fall in purchases of non-electric engines and machines.
In January, the ministry estimated that Brazil’s trade surplus this year will range between $70 billion and $90 billion, above the $68.3 billion surplus recorded in 2025.
Exports Grow and Positive Balance Reinforces Brazilian Foreign Trade at the Beginning of the Year
Brazil's trade balance registered a surplus of US$5.136 billion between January and the second week of February 2026, with a total trade flow of US$72.625 billion. The preliminary data was released this Thursday (February 19th) by the Foreign
Exports Grow and Positive Balance Reinforces Brazilian Foreign Trade at the Beginning of the Year
Brazil's trade balance registered a surplus of US$5.136 billion between January and the second week of February 2026, with a total trade flow of US$72.625 billion. The preliminary data was released this Thursday (February 19th) by the Foreign Trade Secretariat of the Ministry of Development, Industry, Trade and Services (MDIC).
Surplus and Trade Flow at the Beginning of 2026
During this period, the country exported US$38.88 billion and imported US$33.744 billion, guaranteeing a positive balance for foreign trade.
In the second week of February, the weekly results showed:
Surplus: US$ 1.501 billion
Exports: US$ 6.952 billion
Imports: US$ 5.451 billion
Weekly trade flow: US$ 12.403 billion
Accumulated figures for the month up to the second week:
Exports: US$ 13.727 billion
Imports: US$ 12.934 billion
Positive balance: US$ 793 million
Trade flow: US$ 26.661 billion
Growth in daily averages of exports and imports
Compared to February 2025, there was significant growth in daily averages:
Exports: daily average of US$ 1.30 billion (+20.7% compared to 2025)
Imports: daily average of US$ 1.29 billion (+11.4% compared to 2025)
O Performance reinforces the recovery of Brazilian foreign trade and the strengthening of the country's presence in international markets.
Performance by economic sectors
Exports
Extractive Industry: +57.2%
Manufacturing Industry: +15.9%
Agriculture: +1.4%
Imports
Extractive Industry: +20.0%
Manufacturing Industry: +11.8%
Agriculture: -13.4%
The growth in exports of manufactured goods and the extractive industry contributes to the increase in the surplus, while the decline in imports from the agricultural sector indicates an adjustment in input flows.
Economic context and Central Bank projections
According to the Central Bank of Brazil, the 2025 trade surplus was US$ 60 billion, a decrease of 8.9% compared to the previous year, due to increased imports. Projections for 2026 indicate a continued positive balance, with exports between US$340 billion and US$380 billion and imports between US$270 billion and US$290 billion.
This performance reinforces the importance of foreign trade for the Brazilian economy, especially for the agro-industrial sector, which maintains a significant share of exports.

Brazil ran a current account deficit of $68.791 billion in 2025, equal to 3.02% of gross domestic product, the central bank said on Monday. The result was broadly in line with 2024, when the deficit totaled $66.168 billion, or 3.03% of GDP.
Fernando Rocha, head of statistics at the central bank, said the current account position remained “
Brazil ran a current account deficit of $68.791 billion in 2025, equal to 3.02% of gross domestic product, the central bank said on Monday. The result was broadly in line with 2024, when the deficit totaled $66.168 billion, or 3.03% of GDP.
Fernando Rocha, head of statistics at the central bank, said the current account position remained “quite robust.” He noted the deficit had been widening through February 2025 alongside stronger domestic demand, then stabilized through November before narrowing in December. The 2025 shortfall was the largest for the year since 2014, when it reached $110.5 billion.
Rocha said the external deficit was financed by long-term capital inflows, mainly foreign direct investment, which he described as high quality in both flows and stock. Foreign direct investment in the country totaled $77.676 billion in 2025.
He also said Brazil’s trade flow expanded in 2025, with record exports and imports, underscoring deeper integration into the global economy. Against that backdrop, he said the trade surplus posted a “slight reduction,” by $5.9 billion.
That was partly offset by a $2.2 billion narrowing in the services deficit and a $1 billion increase in the secondary income surplus. The primary income deficit—payments such as interest, profits and dividends—was broadly unchanged from 2024.
The central bank released the annual figures alongside December 2025 data, which showed a current account deficit of $3.363 billion, down from a $10.237 billion deficit in December 2024.
The December result was the smallest for that month since 2015, reflecting higher surpluses and smaller deficits across items in the balance of payments. The standout was the trade balance, which improved by $4.7 billion.
Goods exports totaled $350.899 billion in 2025, up 3.2% from 2024, while imports rose 6.2% to $290.947 billion. The trade surplus reached $59.952 billion, down 8.9% from $65.842 billion in 2024.
The services account—covering items such as travel, transport, equipment rentals and insurance—posted a deficit of $52.940 billion in 2025, a 4.1% improvement from a $55.182 billion deficit in 2024.
One key year-on-year change was a $5 billion reduction in net spending on personal, cultural and recreational services. The central bank attributed that shift to a regulatory change that, from January 2025, required online betting operators to become resident companies, meaning betting transactions no longer appeared in the external sector balance of payments.
Net receipts from financial services increased by $1.1 billion.
On the other hand, net spending rose by $2.5 billion for intellectual property services and by $941 million for telecommunications, computer and information services—categories tied to digital platform transactions such as streaming services and software sales.
In travel services, the deficit widened in 2025 to $13.850 billion, reflecting $7.865 billion in receipts—spending by foreign visitors in Brazil—and $21.715 billion in expenditures by Brazilians abroad.
Rocha said spending by tourists in Brazil was the highest in the historical series that began in 1995.

Brazil registered a total positive foreign exchange flow of US$1.544 billion in January up to the 16th, driven by the financial channel, which has accumulated net inflows of almost US$3 billion this year, the Central Bank reported on Wednesday.
The latest data are preliminary and are part of the statistics related to contracted exchange ra
Brazil registered a total positive foreign exchange flow of US$1.544 billion in January up to the 16th, driven by the financial channel, which has accumulated net inflows of almost US$3 billion this year, the Central Bank reported on Wednesday.
The latest data are preliminary and are part of the statistics related to contracted exchange rates.
Through the financial channel, there were net inflows of US$2.939 billion in January up to the 16th. This channel includes foreign direct and portfolio investments, profit remittances, and interest payments, among other operations.
Through the commercial channel, which accounts for exports and imports, the balance for January up to the 16th was negative US$1.395 billion.
WEEK
Last week, from January 12th to 16th, the total exchange rate flow was positive at US$2.215 billion, with the financial channel being the highlight, with a net inflow of US$2.524 billion. On Friday the 16th alone, US$1.674 billion entered the country through the financial channel.
This movement occurs amidst reports in the market, in recent days, of a strong flow of investments into Brazil, especially into the stock market, which continues to be considered attractive by foreign investors.
Last week, the commercial channel registered a net outflow of US$309 million.

Rabobank report highlights IPCA within target, record exports, and challenges for industry. Fed and Mercosur-EU agreement also moved the global scenario
Inflation ends 2025 within target for the first time in five years
The Broad National Consumer Price Index (IPCA) advanced 0.33% in December, according to Rabobank, ending 2025 with a 4.3%
Rabobank report highlights IPCA within target, record exports, and challenges for industry. Fed and Mercosur-EU agreement also moved the global scenario
Inflation ends 2025 within target for the first time in five years
The Broad National Consumer Price Index (IPCA) advanced 0.33% in December, according to Rabobank, ending 2025 with a 4.3% increase — within the inflation target tolerance range for the first time since 2020. The result was close to market projections (0.32%) and below the November index (0.18%).
The appreciation of the real and the restrictive monetary policy helped contain inflationary pressures throughout the year, reducing costs of food, fuel, and industrial goods. The Transportation group was the main highlight in December, driven by airfares (+12.6%) and ride-hailing services (+13.8%), while Housing showed a decrease of 0.33%, influenced by the reduction in electricity tariffs.
Energy was, in fact, the item that most pressured inflation in 2025, with a rise of 12.3%, due to the constant use of tariff flags. For 2026, Rabobank projects inflation of 4.2%, considering a gradual slowdown in the economy and less impact from the agricultural harvest, although fiscal and exchange rate risks may affect the result.
Brazilian industry remains stable and signals a slowdown
Industrial production remained stable in November (0.0%), frustrating growth expectations. Compared to 2024, there was a decrease of 1.2%, with 15 of the 25 sectors analyzed showing a decline. The largest declines occurred in extractive industries (-2.6%), chemicals (-1.2%), and motor vehicles (-1.6%).
On the other hand, pharmaceuticals saw a significant increase of 9.8%. The categories of intermediate goods and durable consumer goods registered contractions, while capital goods and non-durable goods advanced slightly.
Even with modest performance, the industrial sector is still 3.2% above pre-pandemic levels. Rabobank predicts, however, that the scenario of high interest rates and restricted credit will continue to limit expansion in 2026.
Exports drive trade surplus above expectations
The Brazilian trade balance closed 2025 with a surplus of US$ 68.3 billion, exceeding market forecasts. In December, the positive balance was US$ 9.6 billion, resulting from exports of US$ 31 billion and imports of US$ 21.4 billion.
Among the export highlights are crude oil (+74%), soybeans (+73.9%), iron ore (+33.7%), beef (+70.5%), and coffee (+52.9%). China remains the main destination for Brazilian products, with a 39.1% increase in purchases, followed by Europe (+34.2%).
Imports grew moderately (+0.9%), driven by fuels (+42.9%) and fertilizers (+25.4%), reflecting the gradual slowdown of the domestic economy.
European Union confirms support for the agreement with Mercosur
After 25 years of negotiations, the member states of the European Union confirmed their support for the free trade agreement with Mercosur, which could eliminate up to €4 billion in tariffs on products imported from the South American bloc.
The pact foresees zero tariffs for fruits and coffee and a gradual reduction of tariffs for meat, sugar, ethanol, and rice over up to ten years. The official signing is scheduled for the coming days in Paraguay, according to sources from Valor Econômico and Estadão.
Global market attentive to Powell and the US economy
In the United States, the job market created 50,000 jobs in December, below projections. The unemployment rate fell slightly to 4.4%, and Federal Reserve Chairman Jerome Powell was subpoenaed by the Department of Justice for alleged irregularities in the renovation of the institution's building — a fact that reignited debates about the Fed's independence and political pressures on monetary policy.
The global dollar showed moderate appreciation, but the real was one of the best-performing emerging market currencies, appreciating 0.71% during the week, quoted at R$ 5.38. Rabobank projects that the exchange rate will end 2026 at R$ 5.60, influenced by fiscal and political uncertainties.
Macroeconomic Scenario:
What to Expect in 2026
Rabobank maintains its GDP growth projections at 1.6%, the Selic rate at 12.5% per year, and a trade balance surplus of US$68 billion for 2026. However, the institution warns that the environment of fiscal and geopolitical uncertainties, as well as the electoral calendar, could bring volatility to the markets.
Despite the risks, the bank sees solid fundamentals in the Brazilian economy, with inflation under control and a favorable external position, factors that should support the real and foreign trade in the coming months.
This performance was driven by increased sales of soybeans, corn, meat, and sugar, consolidating agribusiness as the main driver of Brazil's trade balance in 2025.
Agribusiness sector drives Brazilian trade balance.
Brazilian agribusiness ended 2025 with record exports of US$169.2 billion, according to data released by Itaú BBA's Agro Consu
This performance was driven by increased sales of soybeans, corn, meat, and sugar, consolidating agribusiness as the main driver of Brazil's trade balance in 2025.
Agribusiness sector drives Brazilian trade balance.
Brazilian agribusiness ended 2025 with record exports of US$169.2 billion, according to data released by Itaú BBA's Agro Consulting firm. The value surpassed the previous record, registered in 2023. Imports also reached the highest level in the historical series, totaling US$ 20.1 billion, resulting in a surplus of US$ 149.1 billion — a 2.8% increase compared to 2024.
The sector maintained strategic relevance in the national economy, representing 49% of all Brazilian exports in 2025, consolidating itself as one of the pillars of the trade balance.
Soybeans lead exports and beef gains prominence
Soybeans were once again the mainstay of foreign sales, with 108 million tons shipped, a 10% increase compared to 2024. Even with a 7% drop in average prices, the soybean complex (grain, meal, and oil) generated US$ 52.9 billion in revenue.
Beef exports also registered strong performance
3.1 million tons were exported, a 21% increase, with an average price of US$ 5,374/t, resulting in US$ 16.6 billion in revenue.
Other animal proteins, such as pork, grew 12% in volume, while fresh chicken meat fell by 6%, reflecting the avian flu outbreak recorded in the middle of the year, which restricted import markets.
Coffee and pulp sustain gains amid volume declines
Even with an 18% decrease in export volume, green coffee reached a historical revenue record, totaling US$ 14.9 billion. The result was driven by a 60% increase in the average price of the product, which reached US$ 6,550/t.
Cellulose also stood out, with a 13% growth in export volume, totaling US$10.25 billion in sales, despite the fall in average international prices.
Sugar and ethanol face contraction with a more competitive international market
The sugar-energy complex was impacted by the fall in global prices and the increase in international supply, which reduced Brazilian shipments.
Raw sugar (VHP) saw a 12% decrease in volume and a 14% decrease in price, resulting in revenue of US$12.08 billion. Refined sugar fell 10% in volume and 16% in price, generating US$2.03 billion.
Ethanol, in turn, registered a 15% reduction in export volume, but with a slight increase of 4% in prices, totaling US$934 million in revenue.
Corn and Cotton Maintain Steady Growth
Corn exports reached 41 million tons, a 3% increase, generating US$8.47 billion in revenue. Cotton lint exports reached a record high volume, totaling 3 million tons—a 9% increase—although average prices fell by 12%, totaling US$4.93 billion.
China Maintains Leadership in Purchases of Brazilian Agribusiness
China continued to be the main destination for agribusiness exports, with US$55.3 billion in purchases—an 11.3% increase compared to the previous year. The main products shipped were soybeans, beef, and cellulose.
The European Union remained the second largest trading partner, with US$25.2 billion in imports, an 8.6% increase, concentrated in coffee, soybeans, and cellulose.
The United States accounted for US$11.4 billion in purchases, a 5.6% decrease, due to the maintenance of tariffs on some Brazilian products.
Outlook
Diversification and added value remain challenges
According to Itaú BBA, Brazilian agribusiness will end 2025 with a solid performance, but faces the challenge of diversifying markets and increasing the added value of its exports. The trend for 2026 is for adjustments in international prices and increasing competition between sugar and ethanol, especially with the increase in corn production and global demand for biofuels.

Brazil ended 2025 with a positive trade balance of US$68.293 billion, the third-best annual result ever recorded, with record exports and stronger import growth, according to data from the Ministry of Development, Industry, Trade and Services (MDIC) released on Tuesday.
Also on Tuesday, the MDIC presented its projection for the trade balan
Brazil ended 2025 with a positive trade balance of US$68.293 billion, the third-best annual result ever recorded, with record exports and stronger import growth, according to data from the Ministry of Development, Industry, Trade and Services (MDIC) released on Tuesday.
Also on Tuesday, the MDIC presented its projection for the trade balance in 2026, predicting a positive result of US$70 billion to US$90 billion.
According to the MDIC's estimate, this year should end with exports between US$340 billion and US$380 billion, while imports would be between US$270 billion and US$290 billion.
The US$68.3 billion surplus in Brazil's trade balance in 2025 exceeded government forecasts. The MDIC (Ministry of Development, Industry and Foreign Trade) projected a positive balance of US$60.9 billion for the year, in an estimate reported in October.
2025
Last year's trade result reflects a value of US$348.7 billion in exports -- the highest level in the historical series -- and US$280.4 billion in imports, also a record level.
Exports in 2025 were 3.5% higher than the previous year's result, a consequence of increased sales volume, more than offsetting a decline in average product prices. Imports, however, rose more sharply, increasing by 6.7% compared to 2024.
Amid the tariffs implemented by the United States on Brazilian products, there was a decline in shipments to the North American country, a drop of 6.6% for the year, according to the MDIC. The United States' share of total Brazilian exports fell from 12.0% in 2024 to 10.8% in 2025.
On the other hand, sales to China grew by 6% during the period, bringing the Asian country's share to 28.7% of Brazilian exports last year, compared to 28.0% in 2024. China is the largest buyer of Brazilian products.
In August of last year, the United States imposed a 50% tariff on a range of Brazilian products, causing alarm in productive sectors and leading the government to announce emergency credit and tax relief measures.
While producers sought alternative markets for their products, negotiations led the United States to expand exceptions to the tariff throughout the year, increasing the list of items exempt from the charge. In November, the government estimated that 22% of exports to the US remained subject to the 50% rate.
Breaking it down by sector, Brazil's exports grew most strongly in agriculture (+7.1%), followed by the manufacturing industry (+3.8%). On the other hand, exports from the extractive industry fell by 0.7%.
The annual balance was boosted by the December result, a surplus of US$9.633 billion, with US$31.037 billion in exports and US$21.405 billion in imports.

Exports Total US$13.4 Billion, Growth Reinforces Need for Technology to Face Unstable Climate and Sanitary Requirements
Brazilian agribusiness ended November with a sign of strength in international trade. Even with more moderate global prices, sector exports reached US$13.4 billion, a 6.2% increase compared to the previous year, driven by
Exports Total US$13.4 Billion, Growth Reinforces Need for Technology to Face Unstable Climate and Sanitary Requirements
Brazilian agribusiness ended November with a sign of strength in international trade. Even with more moderate global prices, sector exports reached US$13.4 billion, a 6.2% increase compared to the previous year, driven by a 6.5% increase in shipped volume. Data from the Ministry of Agriculture and Livestock confirm the expansion of Brazil's presence in the global market and reveal the growing importance of productive efficiency to sustain this performance.
From January to November, the country accumulated US$155.25 billion in agricultural exports, the highest result ever recorded for the period. China remains the main destination, with US$52.02 billion, followed by the European Union and the United States. Markets like India and Mexico have also expanded their purchases, while the trade liberalization of recent years has created more than 500 new destinations for Brazilian products since 2023, expanding opportunities for previously less consolidated supply chains.
However, the production environment is proving more adverse. Studies by Embrapa project a 46% increase in the incidence of agricultural diseases by 2100, affecting crops such as soybeans, coffee, vegetables, and fruits. According to Thiago Grimm, agronomist and specialist in agricultural management and technologies, climate variability increases operational risks. “Extreme events accelerate the cycle of pests and diseases, requiring greater precision in the use of inputs and in the protection of productive areas,” he states.
The November figures show this contrast between commercial expansion and pressure in the field. Soybeans generated US$1.83 billion, a 64.6% increase, while green coffee totaled US$1.5 billion. Cellulose exports reached US$939.2 million and cotton exports registered US$640.1 million, both with strong volume growth. Beans, pulses, and sesame gained ground thanks to the opening of markets such as Russia, Lebanon, Peru, and South Korea. Sesame exports had a record performance, with US$70.9 million and 72,300 tons exported.
To sustain competitiveness, the quality and regularity of production become decisive factors. This is where application engineering plays a strategic role. Failures in droplet formation, underdosing, or limited coverage compromise phytosanitary control, increase costs with reapplications, and amplify the risk of pest resistance.
Francisco de Carvalho, commercial manager of Hydroplan EB, highlights the structural dimension of this process. “Record exports depend on the producer's ability to protect the area precisely. When application is efficient, there is less loss and a lower risk of exceeding sanitary limits required by buyers. It's a silent engineering process that sustains the entire chain,” he states. With new international requirements, increased demand for traceability, and a more unstable climate, Brazil faces the challenge of reducing losses, optimizing inputs, and strengthening technologies that guarantee continuous productivity. Application engineering is establishing itself as one of the pillars that allows the country to maintain its position among the world's largest suppliers of food, fiber, and energy.

Agribusiness exports decline compared to October, but surpass the previous year's performance
Brazilian agribusiness exports totaled US$13.4 billion in November, growing 6% compared to 2024, according to Itaú BBA
Brazilian agribusiness exports totaled US$13.4 billion in November 2025, according to data from the Secretariat of Foreign Trade
Agribusiness exports decline compared to October, but surpass the previous year's performance
Brazilian agribusiness exports totaled US$13.4 billion in November, growing 6% compared to 2024, according to Itaú BBA
Brazilian agribusiness exports totaled US$13.4 billion in November 2025, according to data from the Secretariat of Foreign Trade (Secex) released by Itaú BBA's Agro Consulting. This value represents a 13% decrease compared to October, but a 6% increase compared to the same period in 2024.
The result reflects the strong participation of the soybean complex and the growth in sales of meat and corn, even in a scenario of mixed international prices and adjustments in agricultural commodity prices.
Soybeans Lead Shipments with a 64% Increase
The soybean complex was the highlight of the month, with 4.2 million tons exported, a volume 64% higher than in November 2024. The average price remained stable at US$ 435.4 per ton.
Soybean meal registered a 2.5% increase in shipments, totaling 1.7 million tons, although with an 18% drop in average prices, which stood at US$ 322.1/t. Soybean oil, on the other hand, saw a 47% decrease in export volumes, with 52,000 tons shipped, but the average price rose 17%, reaching US$ 1,133.5/t.
Beef Maintains Strong Export Performance
Fresh beef registered a 40% increase in shipments compared to 2024, totaling 318,500 tons exported. The average price was US$ 5,508.8/t, 13% higher than the previous year, generating revenue of US$ 1.75 billion.
Exports of fresh chicken meat fell 6.5%, totaling 377,000 tons, with a stable price of US$ 1,934.4/t. Pork showed a 14% decrease in volume, with 93,000 tons exported, and a 2% decrease in average prices, which stood at US$ 2,498.6/t.
Sugar, ethanol, and corn: mixed results in the sugar-energy and grain sectors
The sugar-energy sector showed uneven performance. Ethanol exports fell 38% compared to November 2024, totaling 66,000 m³, although the average price rose 10%, to US$ 654/m³.
VHP sugar shipments fell 4.2%, with 2.9 million tons exported and a 21% reduction in average prices, to US$ 372.3/t. On the other hand, refined sugar saw a 13% increase in volumes, reaching 377,000 tons, with an average price of US$ 414.5/t, 22% below that recorded in 2024.
In the grain market, corn registered a 6.4% increase in shipments, totaling 5 million tons, with an average price 5.5% higher than in 2024, at US$ 215.4/t.
Cotton and pulp grow; green coffee and orange juice decline
Cotton maintained a positive pace, with a 34% increase in exported volumes, totaling 403,000 tons, although with a 12% drop in average prices, now at US$ 1,590/t.
Cellulose also showed a 14% growth in volume, totaling 1.85 million tons, with an average price of US$ 507.8/t, slightly below 2024.
Green coffee shipments fell by 26%, reaching 212,000 tons, despite a significant 47% increase in average prices, which reached US$ 7,054/t. Orange juice registered a 20% decrease in exported volume, with an average price of US$ 3,442/t, an 18% drop compared to the previous year.
United States reduces tariffs and boosts new shipments
In November, the United States government announced the exemption of import tariffs for most Brazilian agricultural products, a measure that came into effect on November 13. The decision covers beef, coffee, orange juice, and various fresh and dried fruits, such as mango, açaí, cashew nuts, bananas, and papaya.
With the change, agribusiness exports to the US resumed growth, totaling US$643 million — a 19% increase compared to October, although still 57% below the volume of November 2024.
The American market is strategic for Brazil, and the expectation is for a gradual normalization of shipments in the coming months.
Accumulated exports from January to November exceed US$110 billion
Between January and November 2025, Brazilian agribusiness exports exceeded US$110 billion, supported by the strong performance of soybeans, meat, and pulp.
Itaú BBA highlights that, despite the slight retraction in November, the sector continues on a positive trajectory, with Brazil consolidating itself as one of the largest global exporters of food, fiber, and renewable energy.
In September 2025, exports totaled US$30.5 billion and imports US$27.5 billion, resulting in a surplus of US$2.99 billion and a trade flow of US$58.1 billion. For the year, exports total US$257.8 billion and imports US$212.3 billion, resulting in a surplus of US$45.5 billion and a trade flow of US$470.1 billion.
These results, presented
In September 2025, exports totaled US$30.5 billion and imports US$27.5 billion, resulting in a surplus of US$2.99 billion and a trade flow of US$58.1 billion. For the year, exports total US$257.8 billion and imports US$212.3 billion, resulting in a surplus of US$45.5 billion and a trade flow of US$470.1 billion.
These results, presented on Monday (6) by the Foreign Trade Secretariat of the Ministry of Development, Industry, Commerce, and Services (Secex/MDIC), show that Brazil broke records for exports, imports, and trade flows not only in September but also for the entire year 2025.
Exports, comparing September 2025 (US$30.53 billion) with September 2024 (US$28.47 billion), showed a 7.2% increase. Imports grew 17.7% when comparing September 2025 (US$27.54 billion) with September 2024 (US$23.39 billion).
Thus, in September 2025, trade flows totaled US$58.07 billion, with a trade surplus of US$2.99 billion. Comparing this period with September 2024, there was a 12.0% growth in the trade flow.
Year-to-date, exports, comparing the value from January to September 2025 (US$257.79 billion) with that from January to September 2024 (US$255.01 billion), showed a 1.1% growth. Imports grew 8.2% between the value from January to September 2025 (US$212.31 billion) and January to September 2024 (US$196.3 billion).
Finally, the trade flow totaled US$470.11 billion, representing a 4.2% growth when comparing these periods.
Exports and Imports by Sector
In September 2025, compared to the same month of the previous year, the performance of the exporting sectors was as follows: growth of US$1.03 billion (18.0%) in Agriculture; growth of US$0.56 billion (9.2%) in Extractive Industries; and growth of US$0.42 billion (2.5%) in Manufacturing Industry products.
Compared to the same month of the previous year, the performance of the importing sectors was as follows: growth of US$0.02 billion (3.5%) in Agriculture and US$4.56 billion (21.5%) in Manufacturing Industry products; there was a decrease of US$0.4 billion (26.1%) in Extractive Industries.
Year-to-date, compared to the same period last year, the performance of the export sectors was as follows: growth of US$1.21 billion (2.1%) in Agriculture and US$4.93 billion (3.7%) in Manufacturing; a decline of US$3.55 billion (5.7%) in Extractive Industries.
Compared to the same period last year, the performance of the import sectors was as follows: growth of US$0.37 billion (8.6%) in Agriculture and US$18.48 billion (10.4%) in Manufacturing; a decline of US$2.82 billion (22.1%) in Extractive Industries.

Result is 11.3% higher than the 2024 harvest
Soybeans continue to have the largest share, accounting for R$322.1 billion; peanuts saw the largest growth among crops
Soybeans continue to have the largest share, accounting for R$322.1 billion; peanuts saw the largest growth among crops — Photo: Antônio Neto/Embrapa
The Gross Value of Agricultu
Result is 11.3% higher than the 2024 harvest
Soybeans continue to have the largest share, accounting for R$322.1 billion; peanuts saw the largest growth among crops
Soybeans continue to have the largest share, accounting for R$322.1 billion; peanuts saw the largest growth among crops — Photo: Antônio Neto/Embrapa
The Gross Value of Agricultural Production (GVP), based on August 2025, reached R$1.406 trillion, according to data released today by the Ministry of Agriculture. This figure is 11.3% higher than the 2024 harvest.
For crops, the ministry indicated a 10.8% increase in GVP, which is expected to close the year at R$928.07 billion, up from R$837.52 billion the previous year. Among the products, highlights included peanuts, with a 43% increase, coffee (47.2%), soybeans (8.8%), corn (11.7%), castor beans (38%), and cotton (8.4%).
The most significant negative variations were recorded in potatoes (-61.1%), oranges (-17.9%), beans (-15.9%), rice (-10.2%), bananas (-3.5%), and sugarcane (-1.3%).
Regarding livestock farming, the Ministry of Agriculture (Ministério da Agricultura) indicates a 12.3% increase in GDP, rising from R$425.77 billion last year to an estimated R$478.08 billion for this year.
The ranking of the top five products that showed improved performance compared to the 2024 harvest was as follows: beef (20.5%), chicken (4.7%), milk (5.2%), pork (9.6%), and eggs (14.1%).
Regarding production values, soybeans continue to have the largest share, accounting for R$322.1 billion, followed by corn with R$164 billion, sugarcane with R$117.9 billion, coffee with R$115.2 billion, and cotton with R$36.6 billion. These five products combined accounted for 53.8% of the total GVP.
In livestock, cattle farming accounts for R$204.1 billion, poultry for R$111 billion, and milk for R$71.5 billion, with cattle farming accounting for 14.5% of the total GVP.
States
Regarding regional dynamics, the state of Mato Grosso represents 15.7% of the total GVP, with R$221.3 billion, followed by Minas Gerais with 12% and R$168.3 billion, São Paulo with 11.3% and R$159 billion, and Paraná with 11.2% and R$157.4 billion.
An analysis of products shows that, in Mato Grosso, soybeans, corn, cotton, and cattle represent 93% of the total state GVP, R$221.3 billion. In Minas Gerais, coffee, soybeans, and milk stand out, with a 57% share of R$168.3 billion. In São Paulo, sugarcane, coffee, and oranges account for 63.6% of the total R$159 billion. Finally, in Paraná, corn, soybeans and chicken represent 63.5% of the total of R$157.4 billion.
The Brazilian trade balance registered a trade surplus of US$1.324 billion in the second week of September. According to recently released data from the Foreign Trade Secretariat of the Ministry of Development, Industry, Commerce, and Services (MDIC), this figure was achieved with exports of US$6.935 billion and imports of US$5.611 billio
The Brazilian trade balance registered a trade surplus of US$1.324 billion in the second week of September. According to recently released data from the Foreign Trade Secretariat of the Ministry of Development, Industry, Commerce, and Services (MDIC), this figure was achieved with exports of US$6.935 billion and imports of US$5.611 billion.
For the year, from January to September 2025, the surplus totals US$44.572 billion – an 18% decrease compared to the same period in 2024, when the surplus was US$58.702 billion. The 2025 surplus is the result of US$240.847 billion in exports and US$196.274 billion in imports.
In the first two weeks of September, compared to the same period in September 2024, exports fell 2.2% to US$13.263 billion. This was due to a 4.0% drop in Agriculture, which totaled US$2.603 billion; a 1.1% drop in Extractive Industries, which reached US$2.852 billion; and, finally, a 2.8% drop in Manufacturing Industries, which reached US$7.643 billion.
On the other hand, imports grew 3.3% in the first two weeks of September, totaling US$11.503 billion in the same comparison, with an 11.1% drop in Agriculture, which totaled US$195 million; a drop of 8.9% in the Extractive Industry, which reached US$ 668 million and, finally, growth of 5.0% in the Manufacturing Industry, which reached US$ 10.611 billion.

The Central Bank's Economic Activity Index (IBC-Br) fell 0.5% in July compared to the previous month, according to seasonally adjusted data released by the Central Bank on Monday, a deeper contraction than economists expected.
It was the third consecutive month of decline for the index, which is seen as a signal for Gross Domestic Product.
The Central Bank's Economic Activity Index (IBC-Br) fell 0.5% in July compared to the previous month, according to seasonally adjusted data released by the Central Bank on Monday, a deeper contraction than economists expected.
It was the third consecutive month of decline for the index, which is seen as a signal for Gross Domestic Product. Economists surveyed in a Reuters poll expected a 0.2% contraction.
Compared to July 2024, the IBC-Br rose 1.1%.
The data comes on the eve of the Central Bank's Monetary Policy Committee meeting, where directors are expected to decide to maintain the Selic rate at 15% amid concerns about inflation projections and expectations. The interest rate announcement will be made on Wednesday.
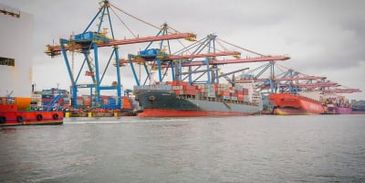
Record shipments of beef tallow, seeds, beans, and peanut oil reinforce the diversification of exports and MAPA's strategy of expanding markets and adding value.
Brazilian agribusiness exports reached US$14.29 billion in August 2025, a 1.5% increase compared to the same month last year. This result was driven by a 5.1% increase in shipped
Record shipments of beef tallow, seeds, beans, and peanut oil reinforce the diversification of exports and MAPA's strategy of expanding markets and adding value.
Brazilian agribusiness exports reached US$14.29 billion in August 2025, a 1.5% increase compared to the same month last year. This result was driven by a 5.1% increase in shipped volume, which offset the 3.4% drop in average international prices.
Soybeans, fresh beef, and corn accounted for the majority of the growth. Soybean shipments totaled 9.3 million tons, up 16.2% from August 2024, generating US$3.88 billion in revenue (+11%). Beef exports totaled 268,000 tons, a 23.5% increase compared to the previous year, totaling US$1.5 billion (+56%). Corn totaled 6.8 million tons, a 12.9% increase, generating US$1.36 billion (+17%).
In addition to traditional export products, some items achieved their best performance in history in August, a result of the market diversification strategy. Beef tallow exported 64,700 tons, a 17.2% increase compared to August 2024, totaling US$74.1 million (+36.4%), the highest value and volume ever shipped for the month. Oilseeds (excluding soybeans) reached 68,500 tons, a 10% increase, with revenue of US$71.3 million (+16.5%), both at record levels. Beans totaled 58,400 tons, a 29% increase, generating US$49.5 million (+27.5%). Pet food reached US$35.9 million, a 22.6% increase compared to the same period last year, also a record for the month. Another highlight was peanut oil, which grew from 2,900 tons in August 2024 to 13,300 tons in August 2025, a 358% increase, with revenue of US$20 million (+573.4%).
Geographic Expansion of Destinations
China remains the largest buyer of Brazilian agricultural products, with US$5.12 billion (a 32.9% increase compared to August 2024), representing 35.8% of the sector's total exports. It is followed by the European Union, with US$1.9 billion.
Among the expanding markets, Mexico stands out, with US$339 million, Brazil's second-largest trading partner in Latin America. Compared to August 2024, its imports nearly doubled (+91.9%), driven primarily by meat. Egypt, with US$342 million, a 14% increase in purchases, driven by corn. Also noteworthy is the growth in sales to Asian countries such as India (+37.3%) and Thailand (+9.5%).
The August results reflect the market opening and diversification strategy implemented by the Ministry of Agriculture and Livestock. In August 2025 alone, 22 new markets were opened, and since August of last year, the number of authorized destinations has increased from 58 to 72. This growth is a direct result of the 55 international trade negotiation and promotion missions held in 2025, which have expanded access to different production chains.

The Path to Brazilian Independence
Brazil’s independence was a pivotal moment in history, marking the country’s break from Portuguese colonial rule. The occupation and exploitation of Brazil by Portugal began in 1500, shaping the nation’s economic and political landscape for over three centuries.
The
The Path to Brazilian Independence
Brazil’s independence was a pivotal moment in history, marking the country’s break from Portuguese colonial rule. The occupation and exploitation of Brazil by Portugal began in 1500, shaping the nation’s economic and political landscape for over three centuries.
The driving force behind Brazil’s political emancipation was Dom Pedro I, son of King João VI of Portugal. The push for independence was fueled by growing pressure from local elites and a series of independence revolts. During this period, several Latin American nations were also engaged in wars against their colonial rulers, intensifying the regional demand for sovereignty.
The defining moment of Brazil’s independence came with the famous “Grito da Independência” (Cry of Independence) on September 7, 1822. Dom Pedro I proclaimed the country’s separation from Portugal on the banks of the Ipiranga River in São Paulo. Shortly after, he was crowned Emperor of Brazil, marking the beginning of the Brazilian Empire, which lasted until 1889.
Brazil’s Independence Day is widely celebrated across the country. Most cities host military parades and student processions, paying tribute to the historical significance of the nation’s sovereignty. The date remains a symbol of national pride and unity.
In the last week of August, the surplus was US$1.474 billion, with sales of US$7.145 billion and purchases of US$5.671 billion.
The Brazilian trade balance recorded a trade surplus of US$6.133 billion in August, after a surplus of US$7.075 billion in July. According to data from the Secretariat of Foreign Trade (Secex) of the Ministry of D
In the last week of August, the surplus was US$1.474 billion, with sales of US$7.145 billion and purchases of US$5.671 billion.
The Brazilian trade balance recorded a trade surplus of US$6.133 billion in August, after a surplus of US$7.075 billion in July. According to data from the Secretariat of Foreign Trade (Secex) of the Ministry of Development, Industry, Commerce and Services (MDIC) released this Thursday, the 4th, the figure was achieved with exports of US$29.861 billion and imports of US$23.728 billion.
In the last week of August, the surplus was US$1.474 billion, with sales of US$7.145 billion and purchases of US$5.671 billion.
Year-to-date
For the year, the surplus is US$42.812 billion. Exports, comparing the value from January to August 2025 (US$227.58 billion) with the same period in 2024 (US$226.54 billion), showed a 0.5% increase. Imports grew 6.9% between the value for the first eight months of 2025 (US$184.77 billion) and the same period in 2024 (US$172.91 billion).
Projections
Last month's result was slightly above the median of financial market estimates, as indicated in the Broadcast Projections survey, of a trade surplus of US$6.050 billion in August.
Projections for this reading ranged from US$5.200 billion to US$6.500 billion.
Composition
In August, exports increased by 3.9% compared to the same period in 2024, with an 8.3% increase in Agriculture, totaling US$6.664 billion; an 11.3% increase in Extractive Industries, reaching US$7.263 billion; and, finally, a 0.9% decrease in Manufacturing, reaching US$15.766 billion.
Imports fell by 2.0% in August compared to the same month last year, with a 0.4% increase in Agriculture, totaling US$440 million; a 26.5% increase in Extractive Industries, reaching US$1.758 billion; and, finally, a 3.8% decrease in Manufacturing, reaching US$21.388 billion.
The Brazilian government concluded sanitary and phytosanitary negotiations last week, resulting in new market openings for national agribusiness products.
In Togo, local authorities authorized the import of corn, brachiaria, soybean, and sorghum seeds from Brazil. Brazilian seeds are internationally recognized for their high genetic qualit
The Brazilian government concluded sanitary and phytosanitary negotiations last week, resulting in new market openings for national agribusiness products.
In Togo, local authorities authorized the import of corn, brachiaria, soybean, and sorghum seeds from Brazil. Brazilian seeds are internationally recognized for their high genetic quality, excellent germination rates, and stringent health standards, the result of continuous investment in research and innovation, which contributes to higher productivity and food security in partner countries.
In Indonesia, local authorities approved the import of live cattle for breeding, which will help strengthen local livestock production while offering Brazilian producers new opportunities to expand business in Asia.
With these announcements, Brazilian agribusiness has achieved 415 market openings since the beginning of 2023, in 71 destinations.
These advances are the result of joint efforts between the Ministry of Agriculture and Livestock (Mapa) and the Ministry of Foreign Affairs (MRE).
Source: Ministry of Agriculture

Exports drive a US$1.28 billion trade surplus in the second week of August, driven by growth in the agricultural, extractive, and manufacturing sectors. Brasília, 11 – The Brazilian trade balance recorded a trade surplus of US$1.286 billion in the second week of August. According to data from the Foreign Trade Secretariat of the Ministry
Exports drive a US$1.28 billion trade surplus in the second week of August, driven by growth in the agricultural, extractive, and manufacturing sectors. Brasília, 11 – The Brazilian trade balance recorded a trade surplus of US$1.286 billion in the second week of August. According to data from the Foreign Trade Secretariat of the Ministry of Development, Industry, Commerce, and Services (MDIC) released this Monday, the 11th, the figure was achieved with exports of US$6.727 billion and imports of US$5.441 billion.
The accumulated surplus for the month of August is US$2.217 billion. For the year, the surplus totals US$39.199 billion.
Through the second week of August, compared to August 2024, exports grew 13.0%, totaling US$8.86 billion. This result was due to 13.1% growth in Agriculture, totaling US$1.90 billion; 17.0% growth in Extractive Industries, reaching US$2.08 billion; and, finally, 11.3% growth in Manufacturing, reaching US$4.83 billion.
Imports also grew 0.5%, totaling US$6.64 billion in the same comparison, with a 13.0% drop in Agriculture, totaling US$104 million; 14.6% growth in Extractive Industries, reaching US$434 million; and, finally, a 0.1% drop in Manufacturing, reaching US$6.06 billion.
Positive performance reflects expansion in exports and imports, consolidating the advance of Brazilian foreign trade in May
Trade Balance for May totals US$ 53 billion and records growth of 1.9% in the trade flow
The Brazilian trade balance ended the month of May with a trade flow of US$ 53.074 billion, which represents an increase of 1.9%
Positive performance reflects expansion in exports and imports, consolidating the advance of Brazilian foreign trade in May
Trade Balance for May totals US$ 53 billion and records growth of 1.9% in the trade flow
The Brazilian trade balance ended the month of May with a trade flow of US$ 53.074 billion, which represents an increase of 1.9% compared to the same period in 2024. The trade balance was positive at US$ 7.239 billion, according to data released this Thursday (6) by the Secretariat of Foreign Trade (Secex), of the Ministry of Development, Industry, Commerce and Services (MDIC).
Check out the main highlights of Brazil's trade performance below:
Year-to-date performance
From January to May 2025, Brazil accumulated:
US$ 136.9 billion in exports
US$ 112.5 billion in imports
US$ 24.4 billion in surplus
US$ 249.4 billion in trade flow
Comparison with May 2024
Compared with the same month of the previous year:
Exports had a slight drop of 0.1%
Imports increased by 4.7%
Trade flow grew by 1.9%
Performance between January and May
In the accumulated total of the first five months of 2025, compared with the same period in 2024:
Exports fell by 0.9%
Imports increased by 9.2%
Trade flow grew by 3.4%
Exports by sector – May 2025 x May 2024
Manufacturing Industry: increase of US$ 0.51 billion (+3.4%)
Agriculture: decrease of US$ 0.05 billion (–0.6%)
Extractive Industry: decrease of US$ 0.51 billion (–6.6%)
Exports by sector – Year-to-date
Agriculture: increase of US$ 0.55 billion (+1.7%)
Manufacturing Industry: growth of US$ 2.5 billion (+3.6%)
Extractive Industry: decrease of US$ 4.46 billion (–12.5%)
Imports by sector – May 2025 x May 2024
Agriculture: decrease of US$ 3.1 million (–0.6%)
Extractive Industry: decrease of US$ 0.82 billion (–45.9%)
Manufacturing Industry: growth of US$ 1.85 billion (+9.5%)
Imports by sector – Year-to-date
Agriculture: increase of US$ 0.35 billion (+14.3%)
Manufacturing Industry: increase of US$ 11.24 billion (+12.1%)
Extractive Industry: decrease of US$ 2.12 billion (-29.5%)
The trade balance continues to perform positively, despite sectoral fluctuations, reflecting the behavior of international markets and the demand for Brazilian products abroad.
Brazil's trade balance registered a surplus of US$7.239 billion in May, according to data from the Foreign Trade Secretariat (Secex) released this Thursday, with exports of US$30.156 billion and imports of US$22.918 billion.
A Reuters survey of economists indicated an expected surplus of US$8.292 billion for the period.
YEAR-TO-DATE
Secex da
Brazil's trade balance registered a surplus of US$7.239 billion in May, according to data from the Foreign Trade Secretariat (Secex) released this Thursday, with exports of US$30.156 billion and imports of US$22.918 billion.
A Reuters survey of economists indicated an expected surplus of US$8.292 billion for the period.
YEAR-TO-DATE
Secex data also showed that the year-to-date trade surplus up to May was positive at US$24.432 billion, 30.6% lower than that recorded in the same period last year.
The performance was the result of exports of US$136.927 billion, compared to imports of US$112.495 billion.
Surplus in the third week of May
Trade balance records 1.5% growth in exports through the third week of May 2025
In the third week of May 2025, the Brazilian trade balance showed a surplus of US$ 1.6 billion, with a trade flow totaling US$ 12.4 billion. Exports totaled US$ 7 billion, while imports reached US$ 5.4 billion in this period.
Accu
Surplus in the third week of May
Trade balance records 1.5% growth in exports through the third week of May 2025
In the third week of May 2025, the Brazilian trade balance showed a surplus of US$ 1.6 billion, with a trade flow totaling US$ 12.4 billion. Exports totaled US$ 7 billion, while imports reached US$ 5.4 billion in this period.
Accumulated for the month of May
In the accumulated for the month, exports reached US$ 16.8 billion and imports totaled US$ 12.5 billion, resulting in a positive balance of US$ 4.3 billion. The registered trade flow was US$ 29.35 billion.
Performance between January and the third week of May
From January to the third week of May 2025, Brazilian exports totaled US$ 124.1 billion, registering a growth of 1.5% in the daily average. Imports totaled US$ 102.1 billion, with a positive balance of US$ 22 billion and a trade flow of US$ 226.2 billion. The data was released this Monday (19) by the Secretariat of Foreign Trade of the Ministry of Development, Industry, Commerce and Services (Secex/MDIC).
Monthly comparison of daily averages
When comparing the daily export averages up to the third week of May 2025 (US$ 1.5 billion) with the full month of May 2024 (US$ 1.4 billion), there was an increase of 6.3%. In imports, the daily average in the third week of May 2025 was US$ 1.139 billion, growing 9.4% compared to the average in May 2024 (US$ 1.042 billion).
Trade flow and daily balance
Until the third week of May, the daily average of the trade flow was US$ 2.668 billion, while the positive daily balance reached US$ 388.36 million. Compared to May 2024, the trade flow grew 7.6%.
Exports by sector
In the period accumulated up to the third week of May 2025, compared to the same period of the previous year, the export sectors presented the following results in the daily average:
Agriculture: growth of US$ 17.65 million (5%)
Extractive Industry: growth of US$ 30.48 million (8.3%)
Manufacturing Industry: growth of US$ 41.98 million (5.9%)
Imports by sector
In the accumulated imports up to the third week of May, the daily average showed sectoral variations:
Manufacturing Industry: increase of US$ 124.65 million (13.5%)
Agriculture: reduction of US$ 1.57 million (-6.5%)
Extractive Industry: drop of US$ 26.21 million (-30.9%)
These data confirm a scenario of moderate growth in Brazilian exports and a significant expansion in imports from the manufacturing industry, reflecting the dynamism of the economy in the first half of 2025.
By the second week of April, Brazilian exports exceeded US$90 billion, while imports totaled US$77 billion, resulting in a surplus of US$13.2 billion
Brazilian Trade Balance Records Surplus and Growth in Exports and Imports through April 2025
Trade Surplus and Growth in Exports
In the second week of April 2025, Brazil's trade balance recorde
By the second week of April, Brazilian exports exceeded US$90 billion, while imports totaled US$77 billion, resulting in a surplus of US$13.2 billion
Brazilian Trade Balance Records Surplus and Growth in Exports and Imports through April 2025
Trade Surplus and Growth in Exports
In the second week of April 2025, Brazil's trade balance recorded a surplus of US$1.6 billion, with a trade flow of US$12.2 billion. This result was driven by exports that reached US$6.9 billion and imports worth US$5.3 billion. Throughout the month, exports totaled US$12.9 billion, while imports totaled US$9.7 billion, resulting in a positive balance of US$3.2 billion and a trade flow of US$22.5 billion.
In the year to date, up to the second week of April, Brazilian exports exceeded US$ 90.2 billion, while imports reached US$ 77 billion. The surplus recorded was US$ 13.2 billion, with a trade flow of US$ 167.2 billion. These data were released by the Foreign Trade Secretariat of the Ministry of Development, Industry, Commerce and Services (Secex/MDIC) on Monday, April 14.
Monthly Performance Comparison
Regarding monthly performance, exports showed a growth of 3.7% when comparing the daily average of exports up to the second week of April 2025 (US$ 1.429 billion) with the same period in April 2024 (US$ 1.378 billion). Imports increased by 8.0% when comparing the daily average of imports up to the second week of April 2025 (US$ 1.1 billion) with the value observed in the same month of 2024 (US$ 995 million).
Thus, the daily average of the trade flow was US$ 2.5 billion, and the daily surplus also showed a growth of 5.5% compared to the previous year, totaling US$ 354.36 million.
Performance by Sector and Product
Exports:
In the accumulated period up to the second week of April 2025, compared to the same period in 2024, the agricultural sector grew by US$ 30.52 million (8.3%), while the manufacturing industry showed an increase of US$ 50.19 million (7.5%). However, the extractive industry sector recorded a drop of US$ 33.64 million (-9.9%).
Imports:
In imports, the agricultural sector saw growth of US$7.04 million (28.2%), while the manufacturing industry saw an increase of US$75.29 million (8.5%). On the other hand, the extractive industry saw a decrease of US$2.98 million (-4.1%) in its imports.
These figures reflect the dynamism of Brazilian foreign trade and changes in export and import patterns in various sectors, highlighting a scenario of sustained growth in some areas and challenges in others.

Welcome! Check out our products